Don't just have data, use it
Business Intelligence
Uncover hidden opportunities. Stop guessing, start knowing. Transform Powerful BI services for your business.

From Data Chaos to Clarity
Business Intelligence for Smarter Business Decisions

What is Business Intelligence?
BI is like a magnifying glass for your company’s information.
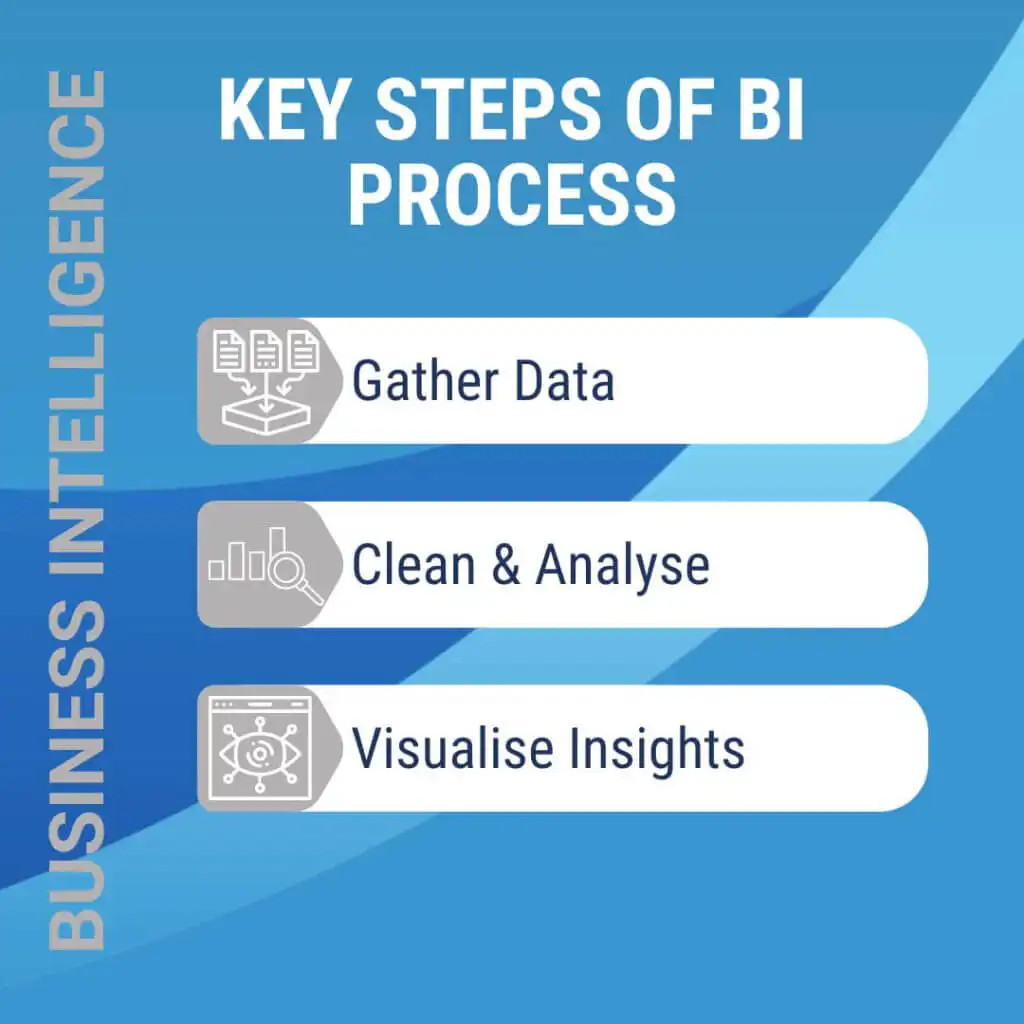
It gathers data from various sources, analyses it, and presents it in clear reports, dashboards, and charts.
This makes it easy to see trends, identify patterns, and understand what’s working (and what’s not) within your organisation.
What are the benefits of business intelligence?
- Boost Sales & Marketing: BI helps you understand customer behaviour, target campaigns more effectively, and optimise pricing strategies
- Improve Operational Efficiency: Identify areas for improvement, streamline processes, and reduce costs by leveraging data-driven insights
- Make Smarter Decisions: BI empowers you to make informed choices based on real data, not just hunches, leading to better business outcomes
Building Your BI Roadmap
How does the business intelligence process work?
- Understanding Your Needs: We start by working with you to identify your specific business goals and what insights you want to uncover
- Data Gathering & Cleaning: We gather data from various sources and clean it up to ensure accuracy and consistency
- Analysis & Visualisation: Data is then analysed to identify trends and patterns, presented in clear reports, dashboards, and easy-to-understand charts


See Beyond the Data
Why business intelligence is important?
- Informed Decisions: BI transforms data into insights, guiding better choices for your business
- Customer Understanding: BI helps analyse behaviour, leading to better products and experiences.
- Operational Efficiency: BI reveals inefficiencies, boosting productivity and potentially increasing revenue
- Competitive Edge: BI analyses trends & competitor strategies, giving you a market edge
- Real-Time Insights: Access to real-time data through BI tools, offering a significant advantage in fast-paced market environments
Business Intelligence Tools Guide
Types of business intelligence tools and applications
Business intelligence (BI) offers a suite of tools to analyse your data.
These go beyond reports, providing user-friendly dashboards, in-depth analytics, and more.
A key feature is ad hoc analysis, allowing you to ask specific questions and uncover hidden trends on the fly.
Think of BI as a powerful search engine for your data, driving better business decisions.
Deep Dive into BI Tools: Online analytical processing (OLAP); Mobile BI; Real-time BI
- OLAP: Analyse sales data from various angles (region, product, timeframe) to uncover hidden trends
- Mobile BI: Access key reports & dashboards on your smartphone for informed on-the-go decisions
- Real-time BI: Gain instant insights into operations, allowing for swift reactions to changing trends
Expanding Your BI Options: Operational Intelligence (OI), Software-as-a-Service (SaaS) BI, and Open-source BI (OSBI)
- Operational Intelligence (OI): Monitor real-time data like inventory or customer service metrics to optimise daily operations
- SaaS BI: Cloud-based BI with subscriptions, ideal for businesses of all sizes seeking affordability and easy setup
- Open-source BI: Cost-effective option for companies with strong IT teams for customisation (requires technical expertise)
FAQ
What are the 4 concepts of business intelligence?
While there isn’t a universally agreed-upon set of four concepts, some core principles of BI include:
- Data collection and integration: Gathering data from various sources within your organisation and unifying it into a central location for analysis
- Data analysis and reporting: Applying various tools and techniques to extract insights and meaning from your data, often presented in reports and dashboards
- Data visualisation: Transforming raw data into easy-to-understand charts, graphs, and other visual formats to communicate insights effectively
- Performance measurement and KPI tracking: Defining key performance indicators (KPIs) to track progress towards business goals and measure the effectiveness of data-driven decisions
What are the five basic tasks of business intelligence?
BI involves a series of ongoing tasks to unlock the power of your data:
- Identifying key business questions: Understanding the specific information you need from your data to address critical business challenges
- Data extraction and transformation: Gathering data from various sources and transforming it into a consistent format for analysis
- Data analysis and modelling: Applying statistical techniques and models to identify trends, patterns, and relationships within your data
- Data visualisation and reporting: Creating clear and concise reports and dashboards to communicate insights to stakeholders
- Data governance and security: Ensuring the accuracy, security, and accessibility of your data throughout the BI process
What are the top business intelligence services providers?
While specific needs vary, some leading BI solution providers are well-established in Australia and cater to local businesses. Here are a few to consider:
- Microsoft Power BI: A popular choice due to its integration with other Microsoft products and affordability (free tier available)
- Tableau: Renowned for its user-friendly interface and strong data visualisation capabilities
- Qlik: Offers a powerful in-memory analytics engine for complex data exploration, with a presence in Australia
- Looker (now part of Google Cloud): Gaining traction with its focus on embedded analytics and cloud-based deployment. Australian businesses using Google Cloud may find it a good fit
- Domo: While a strong player globally, Domo’s market presence in Australia might be smaller compared to the others. It’s worth exploring if their specific features align perfectly with your needs
What are the main types of business intelligence tools and applications?
The BI landscape offers a vast array of tools, each serving a specific purpose. Here are some key categories:
- Ad hoc analysis: Allows users to ask specific questions of their data on the fly, uncovering hidden trends
- Online Analytical Processing (OLAP): Enables multi-dimensional analysis of data, allowing you to slice and dice information by region, product, or timeframe
- Mobile BI: Provides access to reports and dashboards on smartphones and tablets for on-the-go insights
- Real-time BI: Analyses data as it’s generated, offering an up-to-date view of operations and customer behaviour
- Operational intelligence (OI): Delivers real-time information to managers and frontline workers to aid in operational decision-making
- Software-as-a-Service (SaaS) BI: Cloud-based BI solutions accessible through a subscription, offering affordability and ease of implementation
- Open-source BI (OSBI): Free or low-cost option requiring technical expertise for setup and maintenance
- Embedded BI: Integrates BI functionality directly into business applications for in-context data analysis
- Collaborative BI: Combines BI tools with collaboration features to enable teamwork and information sharing during data analysis
- Location intelligence (LI): Analyses location and geospatial data, providing insights based on geographic factors
What is an example of a business intelligence tool?
Example of a Business Intelligence Tool: Microsoft Power BI is a popular BI platform offering a variety of features for data analysis and visualisation
What are business intelligence methods?
Business intelligence (BI) utilises various methods to extract valuable insights from your data. Here are some key techniques:
- Data mining: Imagine sifting through a mountain of information to find hidden gems. Data mining uses sophisticated algorithms to uncover patterns, trends, and relationships within your data that might not be readily apparent
- Statistical analysis: This method involves applying statistical techniques to your data to measure trends, assess risks, and identify correlations. Think of it as using math to make sense of your data and uncover deeper meaning
- Data warehousing: Businesses collect data from various sources, but it often resides in separate systems. Data warehousing involves consolidating all this data into a central repository, making it readily accessible for BI tools and analysis
- Data visualisation: Raw data can be overwhelming. Data visualisation transforms numbers and figures into charts, graphs, and other visual formats. This makes it easier to identify patterns, trends, and communicate insights to stakeholders
- Data storytelling: Data is powerful, but stories resonate. BI methods often involve crafting a narrative around the insights gleaned from data. This helps decision-makers understand not just what the data says, but also its significance and implications for the business
What is business intelligence software used for?
Business intelligence software goes beyond simple reporting. It offers a comprehensive suite of tools to transform your data into actionable insights that can empower your business. Here are some key uses:
- Improved Decision-Making: BI equips you with data-driven insights to make informed decisions across all areas of your business. This could involve anything from product development and marketing campaigns to resource allocation and budget forecasting
- Enhanced Operational Efficiency: BI helps you identify areas for improvement within your operations. By analysing data on processes, workflows, and resource utilisation, you can streamline operations, reduce costs, and boost overall efficiency
- Risk Management and Mitigation: BI helps you identify potential risks and threats to your business. By analysing trends and patterns in data related to security breaches, customer churn, or market fluctuations, you can take proactive measures to mitigate risks and safeguard your business
- Increased Customer Satisfaction: BI provides insights into customer behaviour, preferences, and feedback. This allows businesses to tailor products and services to meet customer needs, personalise marketing campaigns, and ultimately enhance customer satisfaction and loyalty
- Competitive Advantage: In today’s data-driven world, businesses that use BI to gain insights from their data can gain a significant competitive edge. By understanding market trends, customer behaviour, and operational performance better than the competition, businesses can make smarter strategic decisions and stay ahead of the curve
What are the three major types of business intelligence?
BI can be categorised into three main areas, each focusing on a different aspect of data analysis:
- Descriptive BI: This is the foundation, providing insights into what happened in the past. Imagine looking back at sales figures or customer interactions to understand past performance. Descriptive BI tools summarise historical data through reports and dashboards, offering a clear picture of what has transpired
- Diagnostic BI: This type delves deeper, analysing past data to identify the root causes of trends and patterns. Think of it as asking “why” behind the “what.” Diagnostic BI helps you understand the factors influencing specific outcomes, allowing you to address underlying issues and make improvements
- Predictive BI: This is the future-focused type, using historical data and statistical modelling to forecast future trends and make informed predictions. Imagine trying to predict customer demand or market fluctuations. Predictive BI allows businesses to anticipate future scenarios and make proactive decisions based on those predictions
By combining these three types of BI, businesses can gain a holistic understanding of their data, make smarter decisions, and achieve their strategic goals.
Explore Our Business Intelligence Solutions
Let's Build Your Customised BI Strategy